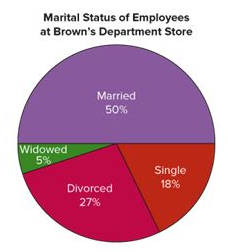
Pie Graph
Pie graphs are used extensively in statistics. The purpose of the pie graph is to show the relationship of the parts to the whole by visually comparing the sizes of the sections. Percentages or proportions can be used. The variable is nominal or categorical.
Pie Graph is a circle that is divided into sections or wedges according to the percentage of frequencies in each category of the distribution.
Example:
